This product has limited availability. Some accessories, replacement parts, or services may still be available when it is no longer available.
Overview
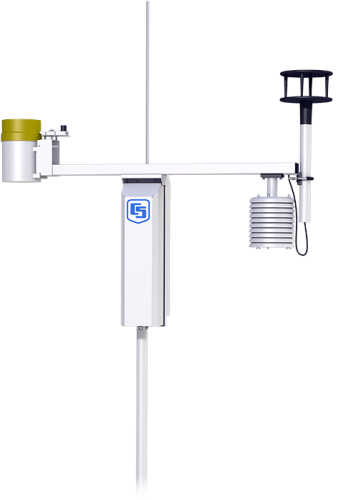
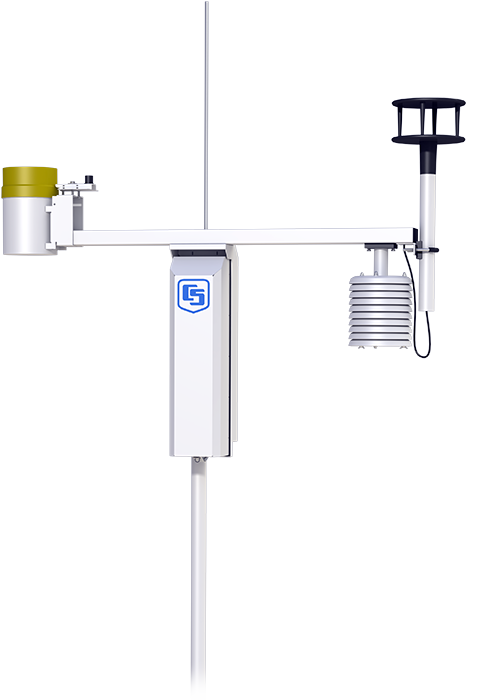
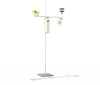
Our ET107 ETo station consists of meteorological sensors, an aluminium 3 m pole, and an environmental enclosure that houses a CR1000M module and a 7 Ahr sealed rechargeable battery. The battery is recharged via an ac transformer or a 10 W solar panel. Sealed circular connectors are provided on the outside of the enclosure to simplify sensor hookup.
Read MoreBenefits and Features
- Monitors temperature, relative humidity, wind speed and direction, solar radiation, and precipitation
- Automatically calculates potential evapotranspiration (ETo)
- Accurate measurements you can rely on
- Pre-configured with some pre-assembly for easy installation
- Rugged, low-power design for long-term, reliable operation
- Looks great and fits well in public settings
- Multiple sensor and communication options
Technical Description
Our ET107 ETo station consists of meteorological sensors, an aluminium 3-m pole, and an environmental enclosure that houses a CR1000M module and a 7-Ahr sealed rechargeable battery. The battery is recharged via ac power or a 10-W solar panel. Sealed circular connectors are provided on the outside of the enclosure to simplify sensor hookup.
Meteorological sensors included with the ET107 are the CS305-ET Solar Radiation Sensor, HMP60-ETS Air Temperature and Relative Humidity Probe, TE525-ET Tipping Bucket Rain Gauge, and either the 034B-ETM Wind Set or WindSonic1-ETM 2-D Sonic Wind Sensor.
The ET107 can also measure the:
Images
3D/CAD Files:
Compatibility
Replacement sensors for the ET107 have a -ET or -ETM suffix. These sensors are listed under Ordering.
The ET107 can also measure the:
Specifications
| -NOTE- |
The ET107 has components that have their own specifications. To review these specifications, refer to the appropriate products below: |
Resources and Links
Product Brochures
Downloads
ET107 Default Programs (4 KB) 29-03-2021
One default program is for an ET107 with the 034B wind sensor and another default program is for an ET107 with a WindSonic1.
ET107 ETsz Example Programs (290 KB) 23-06-2021
The ETsz() instruction requires the user to input lattitude, longitude, elevation, and crop type for a station's location in order to generate accurate calculations of ET. The Generic_ET_107_ETsz.CR1 and Generic_ET_107_ETsz_Windsonic.CR1 programs use the ConstTable() intruction to create a constants table that allows the user to easily input these values using Loggernet, PC400, or a keyboard display. These values only need to be set once, during station set up.
FAQs for
Number of FAQs related to ET107: 16
Expand AllCollapse All
-
Refer to the “Maintenance and troubleshooting" and "Schematics of connectors” sections of the ET107 Weather Station Instruction Manual for procedural instructions.
-
The communications options include direct serial connection, short haul modem, analog phone modem, cellular phone modem, radio, and Wi-Fi. Also, with an enclosure alteration, an Ethernet port can be added.
Note: Some of the listed telemetry options can drastically alter the power budget of the station.
-
The PS100 power supply that’s in the ET107 specifies a charging voltage of 15 to 28 Vdc or 18 Vac RMS. A 24 Vac transformer will blow the protective circuitry in the PS100.
-
Calsense Command Center software can interface with Campbell Scientific’s VisualWeather software, which can retrieve values from the ET107. In the Command Center software, setting up a station involves connecting to the VisualWeather LoggerNet server and selecting variables from the weather station’s listing for wind speed, rainfall, and ETo.
-
Wind speed, wind direction, solar radiation, temperature, relative humidity, and rain measurements are data parameters that are available. Typically, ETo is calculated by the software; however, it is possible for the ET107 to perform the calculation as well.
-
Yes. However, special data logger programming is required. Contact an application engineer at Campbell Scientific for assistance.
-
Campbell Scientific recommends the following maintenance schedule:
- Once a week: check the rain gage funnel, and clean as necessary.
- Once a month: check the solar radiation sensor, and clean as necessary.
- Every 3 months: clean the temperature/RH radiation shield.
- Every 6 months to 1 year: replace the two desiccant packs (pn 4905).
- Every 1 to 3 years: have Campbell Scientific replace the wind speed bearings and reed switch. Request a return material authorization (RMA) number by following the steps listed on our Repair and Calibration page.
- Every 1 to 3 years: replace the relative humidity chip (pn 9598).
- Once every 3 years: have Campbell Scientific calibrate the solar radiation sensor. Request a return material authorization (RMA) number by following the steps listed on our Repair and Calibration page.
- Once every 5 years: have Campbell Scientific calibrate the rain gage sensor. Request a return material authorization (RMA) number by following the steps listed on our Repair and Calibration page.
- Once every 5 years: have Campbell Scientific calibrate the data logger. Request a return material authorization (RMA) number by following the steps listed on our Repair and Calibration page.
-
The most significant difference is that the retired ET106 used the CR10X datalogger, whereas the ET107 uses the CR1000 datalogger. Other differences are the following:
- As a design improvement, the ET107 has a seal incorporated into its lid assembly.
- The ET107 uses a CS300 pyranometer instead of the LI200X pyranometer.
- The ET107 provides a choice of wind sensor (either the 034B or the WindSonic1), whereas the ET106 could only be used with the 034B.
-
If VisualWeather is used with the ET107, T107 (Toro), ET106, or MetData1, and the station has a standard configuration, setting up the station in VisualWeather is relatively simple. Select the station from the list in the Weather Station Network screen, and most of the work is automatically performed.
If, however, a custom station, a different station model, or a different variation for one of the sensors is used, it is necessary to set up a custom station in the Weather Station Network setup screens. In the Station Selection screen, select Custom.
Follow the screens that ask about the details of the station. Then, VisualWeather will connect to the station and get the names and fields of the data tables on the station where the data is stored. Because the names and fields of these tables are meaningless to VisualWeather, a mapping process must be used to map data table fields to fields and units that VisualWeather recognizes. This mapping allows VisualWeather to create screens and reports that are meaningful.
Because the data tables are often identified with a number and the fields are often cryptic, the mapping process can sometimes be confusing. To map fields for a custom station, contact Campbell Scientific for assistance.
Case Studies
According to a report from the United States Golf Association (USGA), the average golf course......read more
Privacy Policy Update
We've updated our privacy policy. Learn More
Cookie Consent
Update your cookie preferences. Update Cookie Preferences